Chapters
Product Design Intern
2 Designers
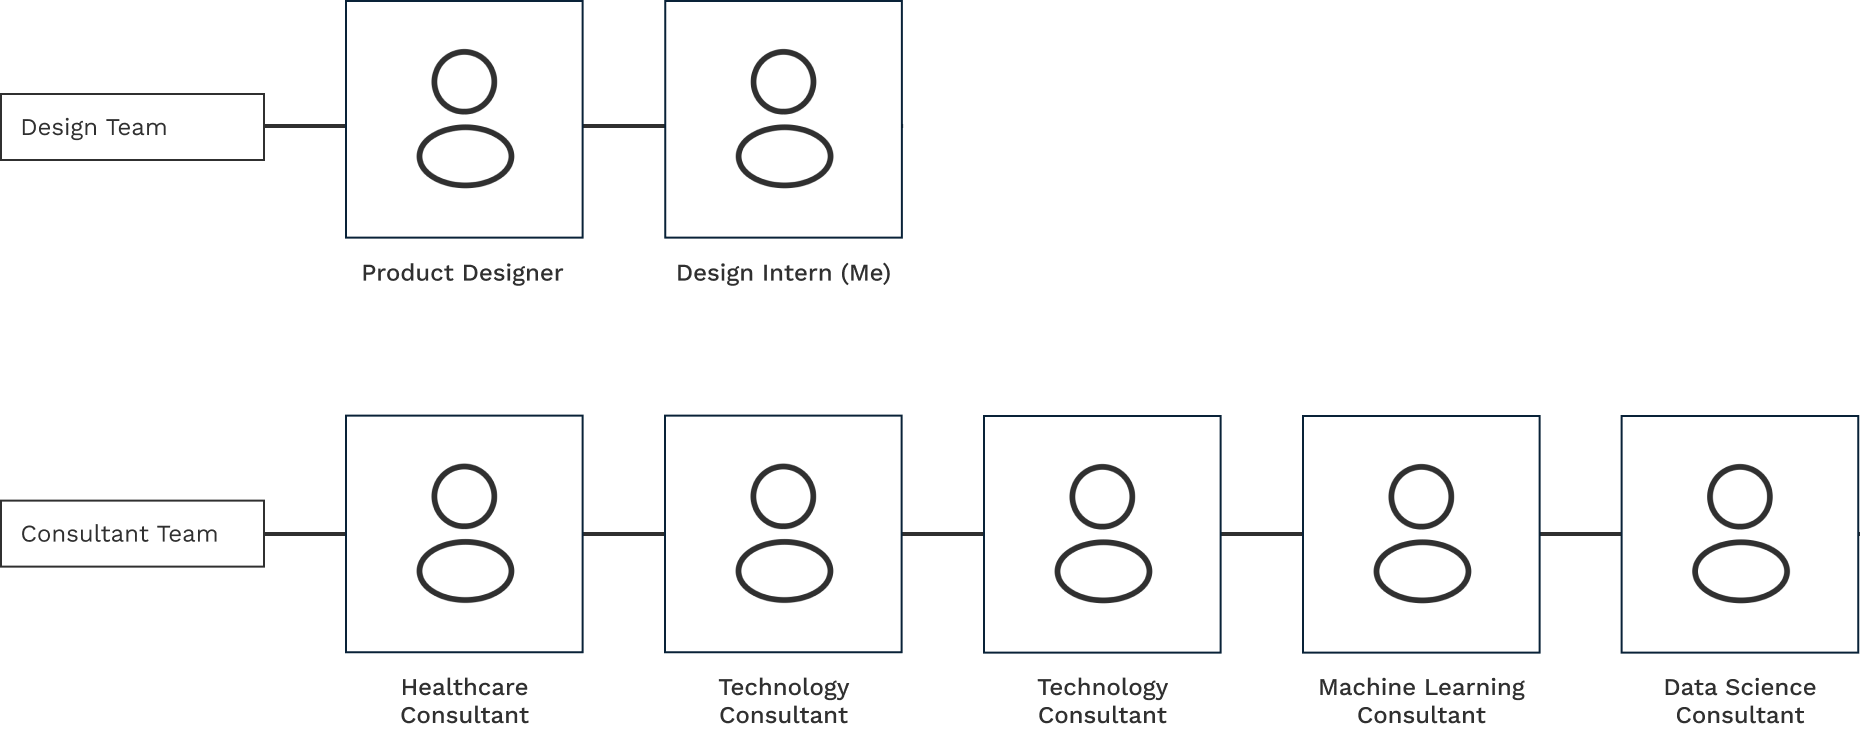
5 Consultants
July 2023
(4 Weeks)
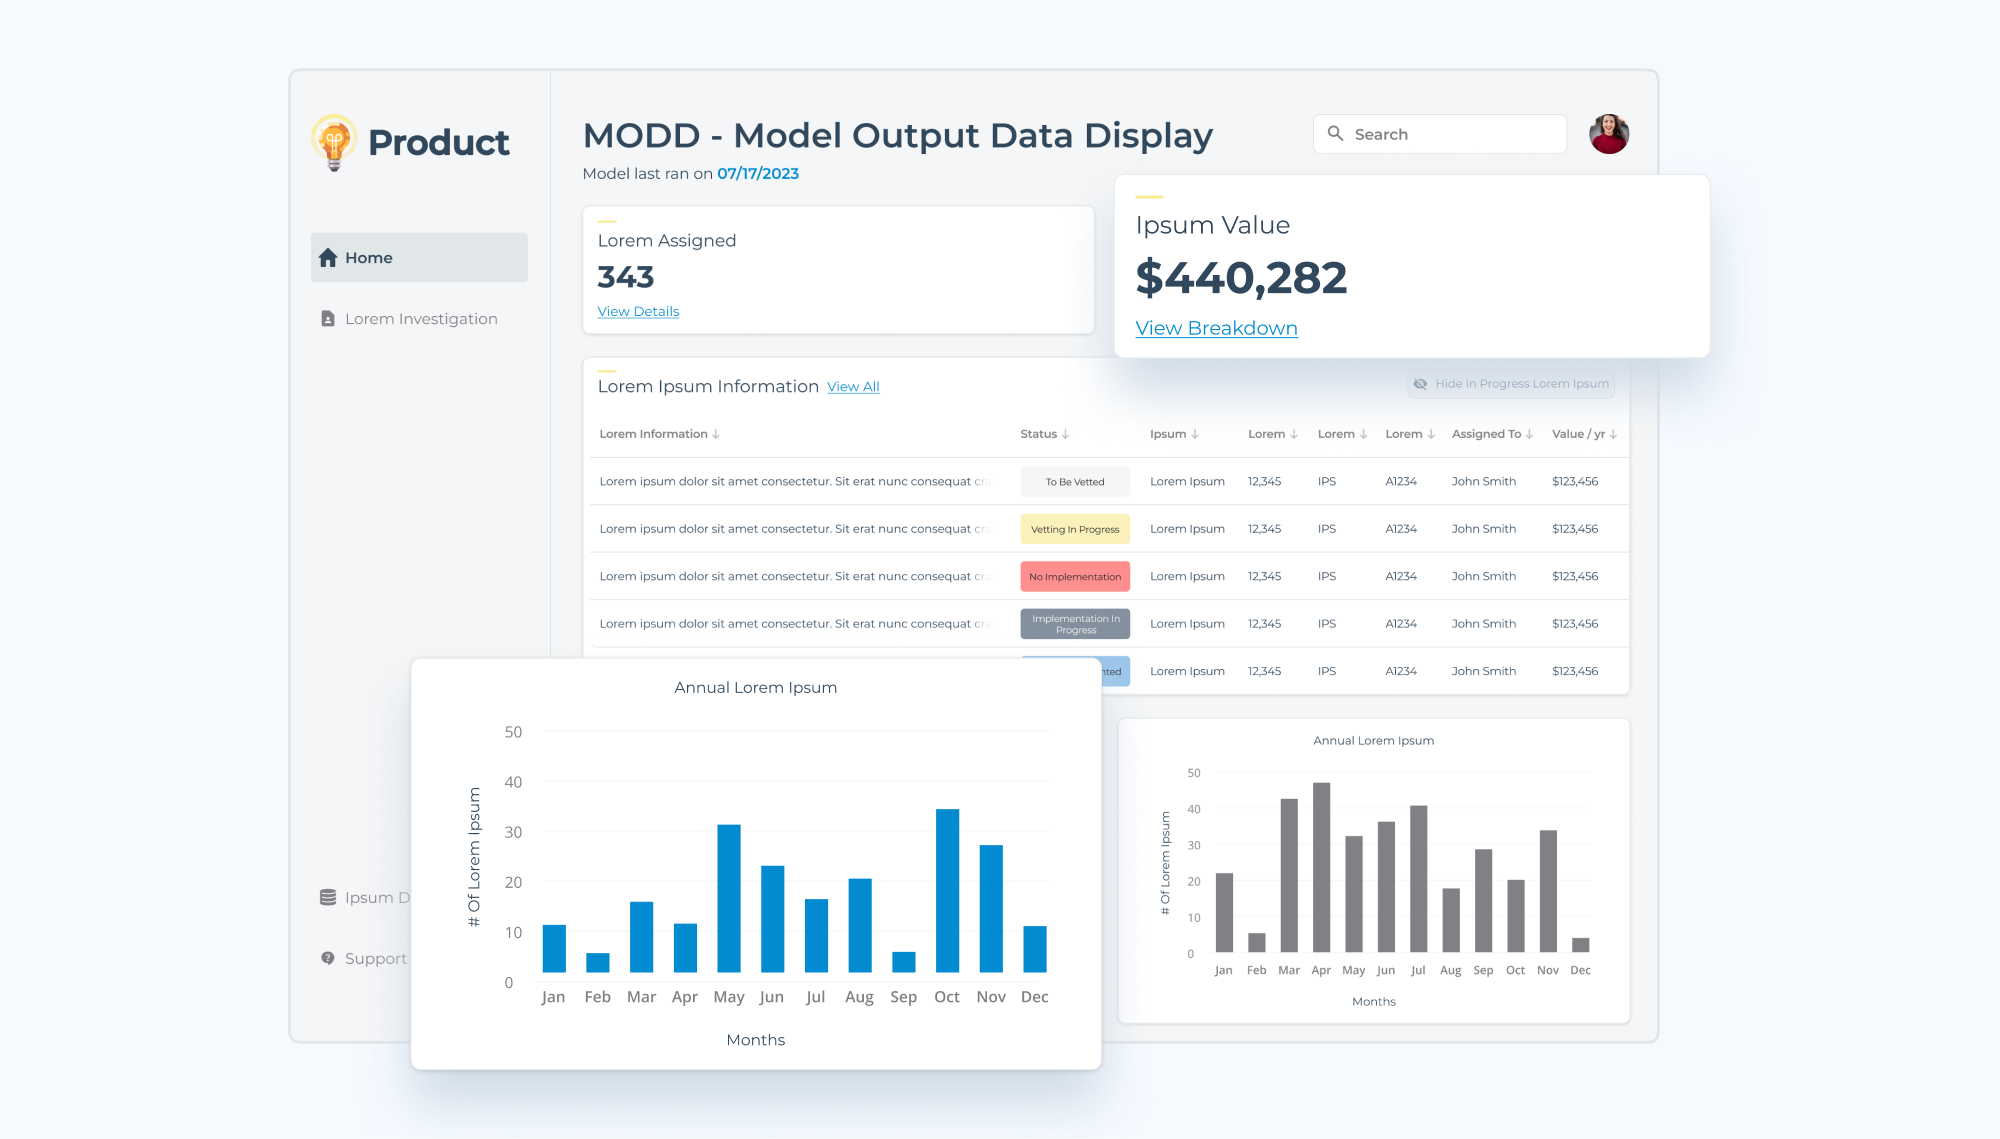
A machine learning, healthcare, data science, and technology consultant team has been working on a data model that processes claims more accurately for the client. They need to display their findings in a visually appealing way. Due to NDA, some content has been modified and blurred for client confidentiality.
The design needs to be delivered to the consultants by the end of the 4-week design phase because soon after the deadline, the team will present the work to the client’s VP, CTO, and CFO.
In addition to the 5 consultants who would serve as our primary stakeholders, I collaborated with a more experienced product designer. We bounced ideas off each other and worked on the designs from start to finish.
This document would be in the form of a Figma prototype. The deliverable will allow the user to reveal and manipulate data through thoughtful animations, keeping the viewer engaged. Additionally, the document could also be presentable when printed on paper.
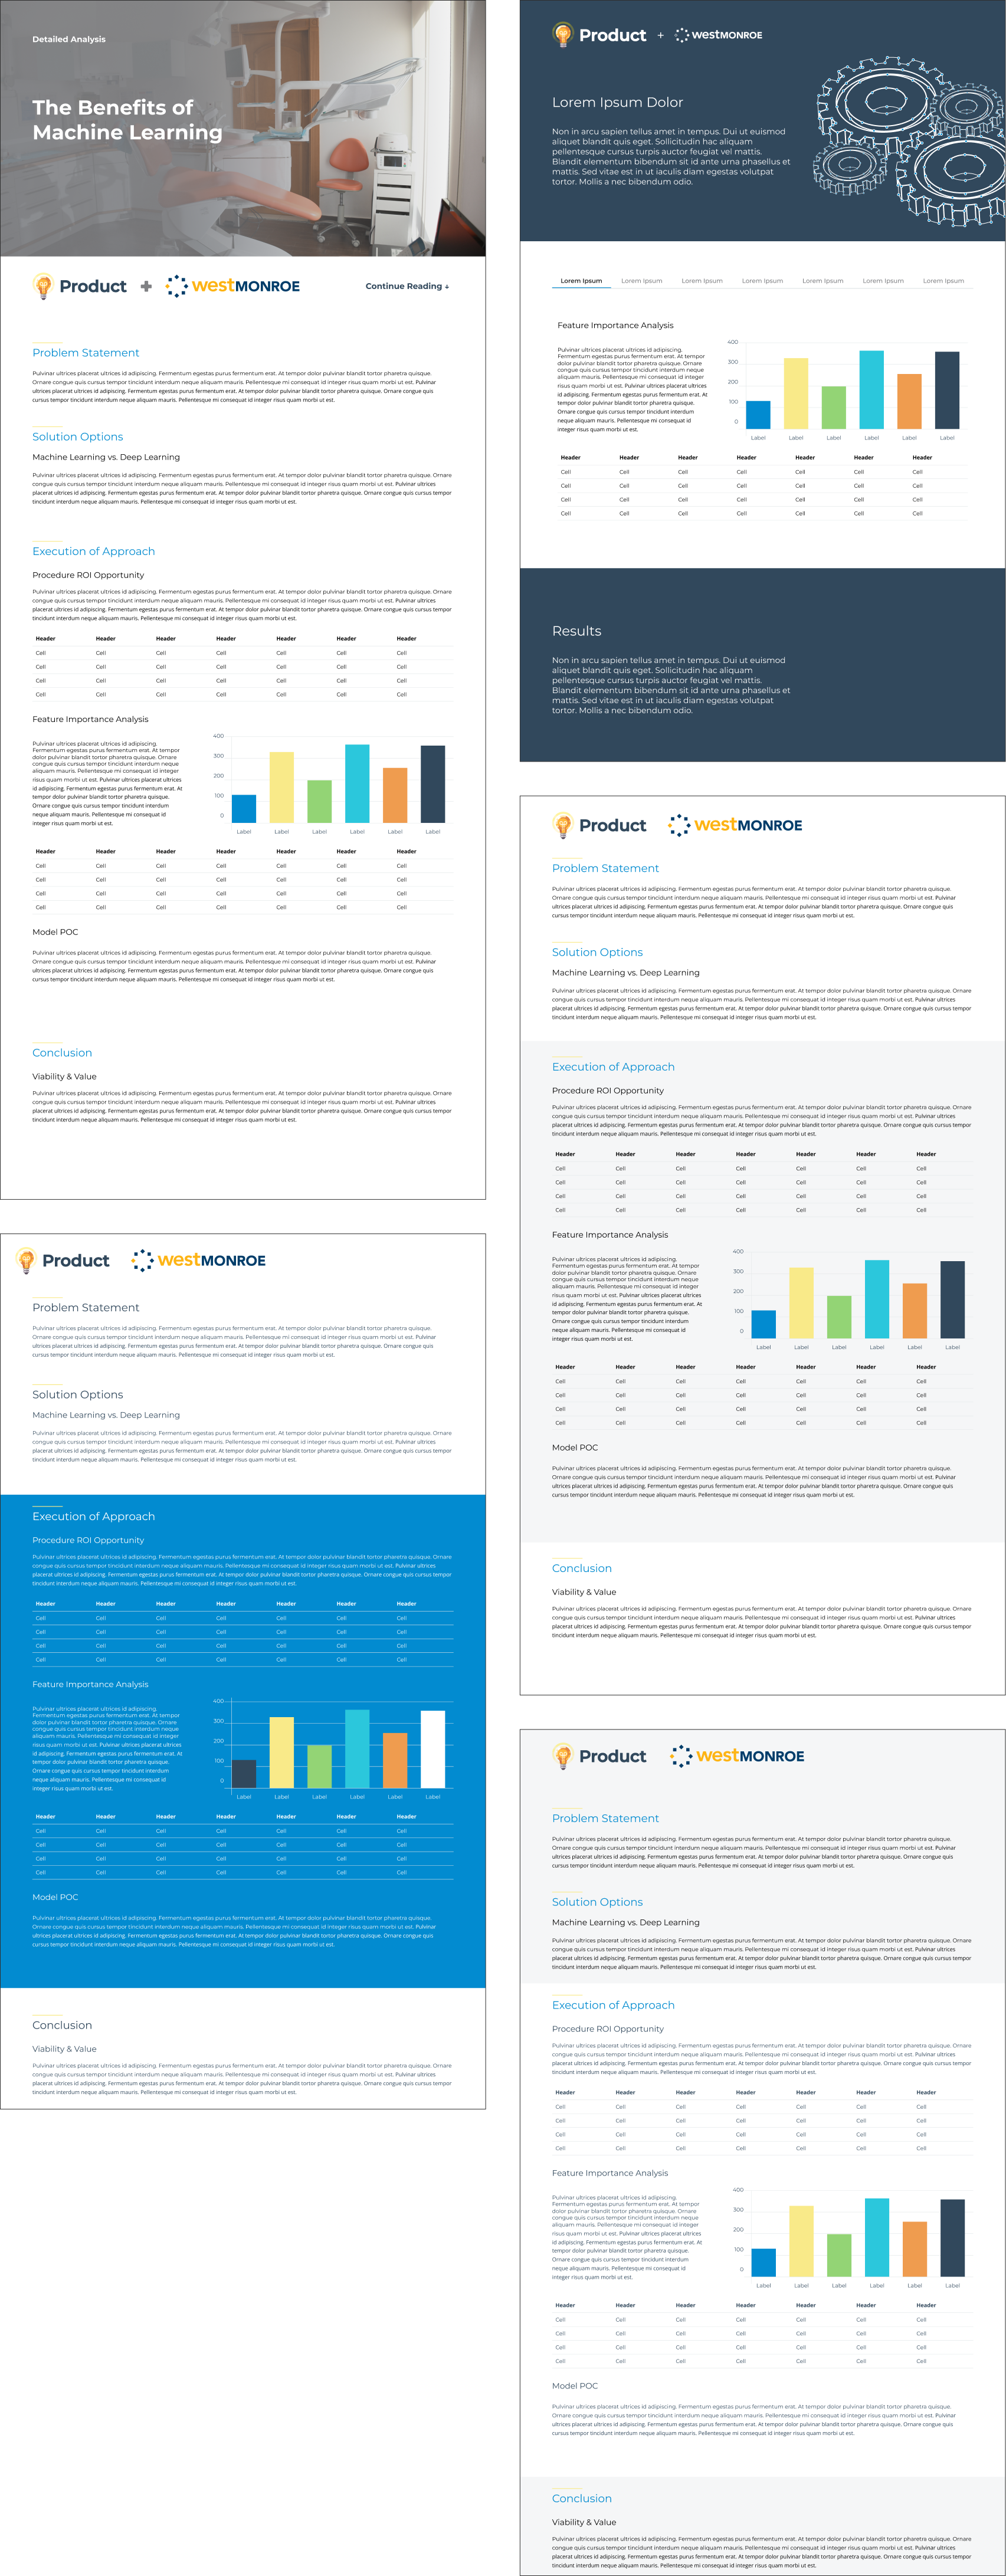
The consultant team notified my partner and me that plans had changed. It meant we would start from square one with just 2 more weeks before the deadline. Additionally, model data continued to be unavailable. So, placeholder text and guessing had to be used to counter the vagueness.
The process involved creating placeholder widgets on the screen and waiting until the consultant team handed me and my partner data from the model. Once we had some data in our hands, we moved elements around and bounced ideas off one another while catering to the consultant team’s recommendations, critiques, and changes in content.
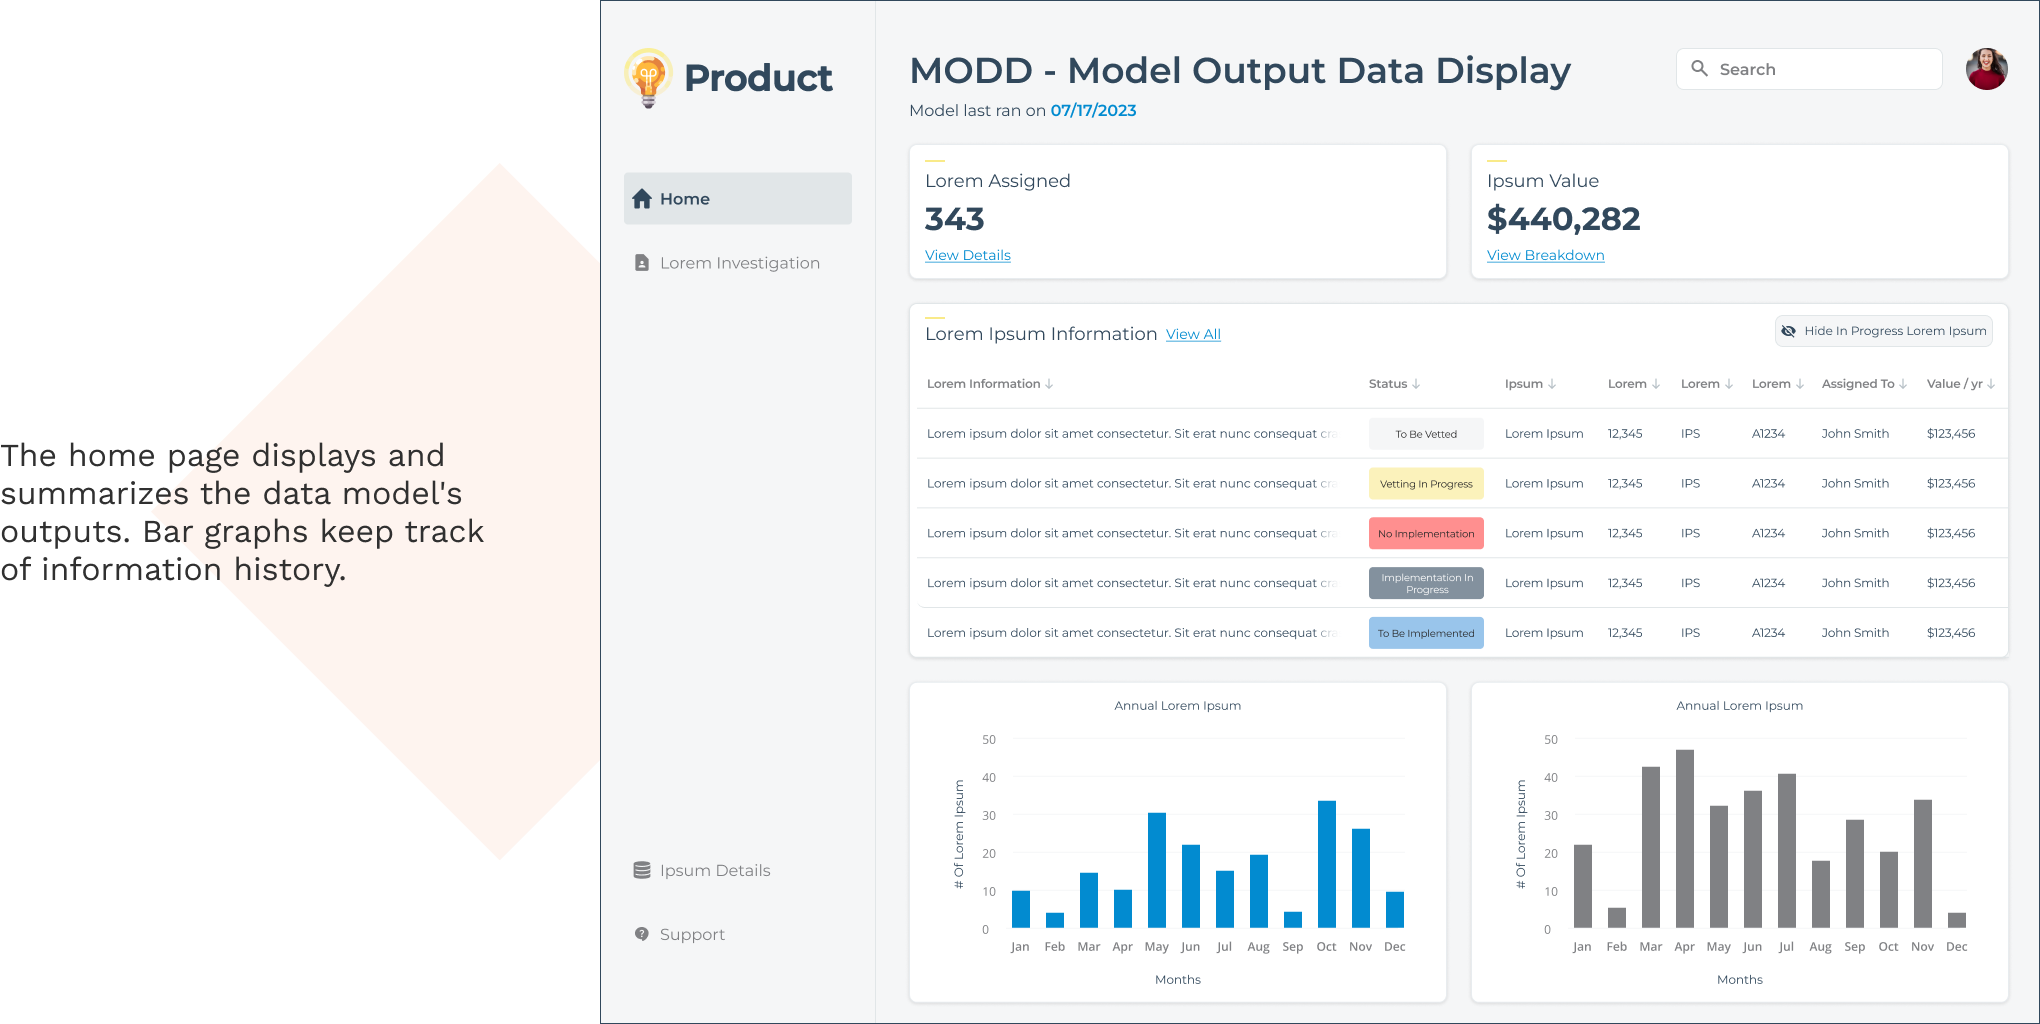
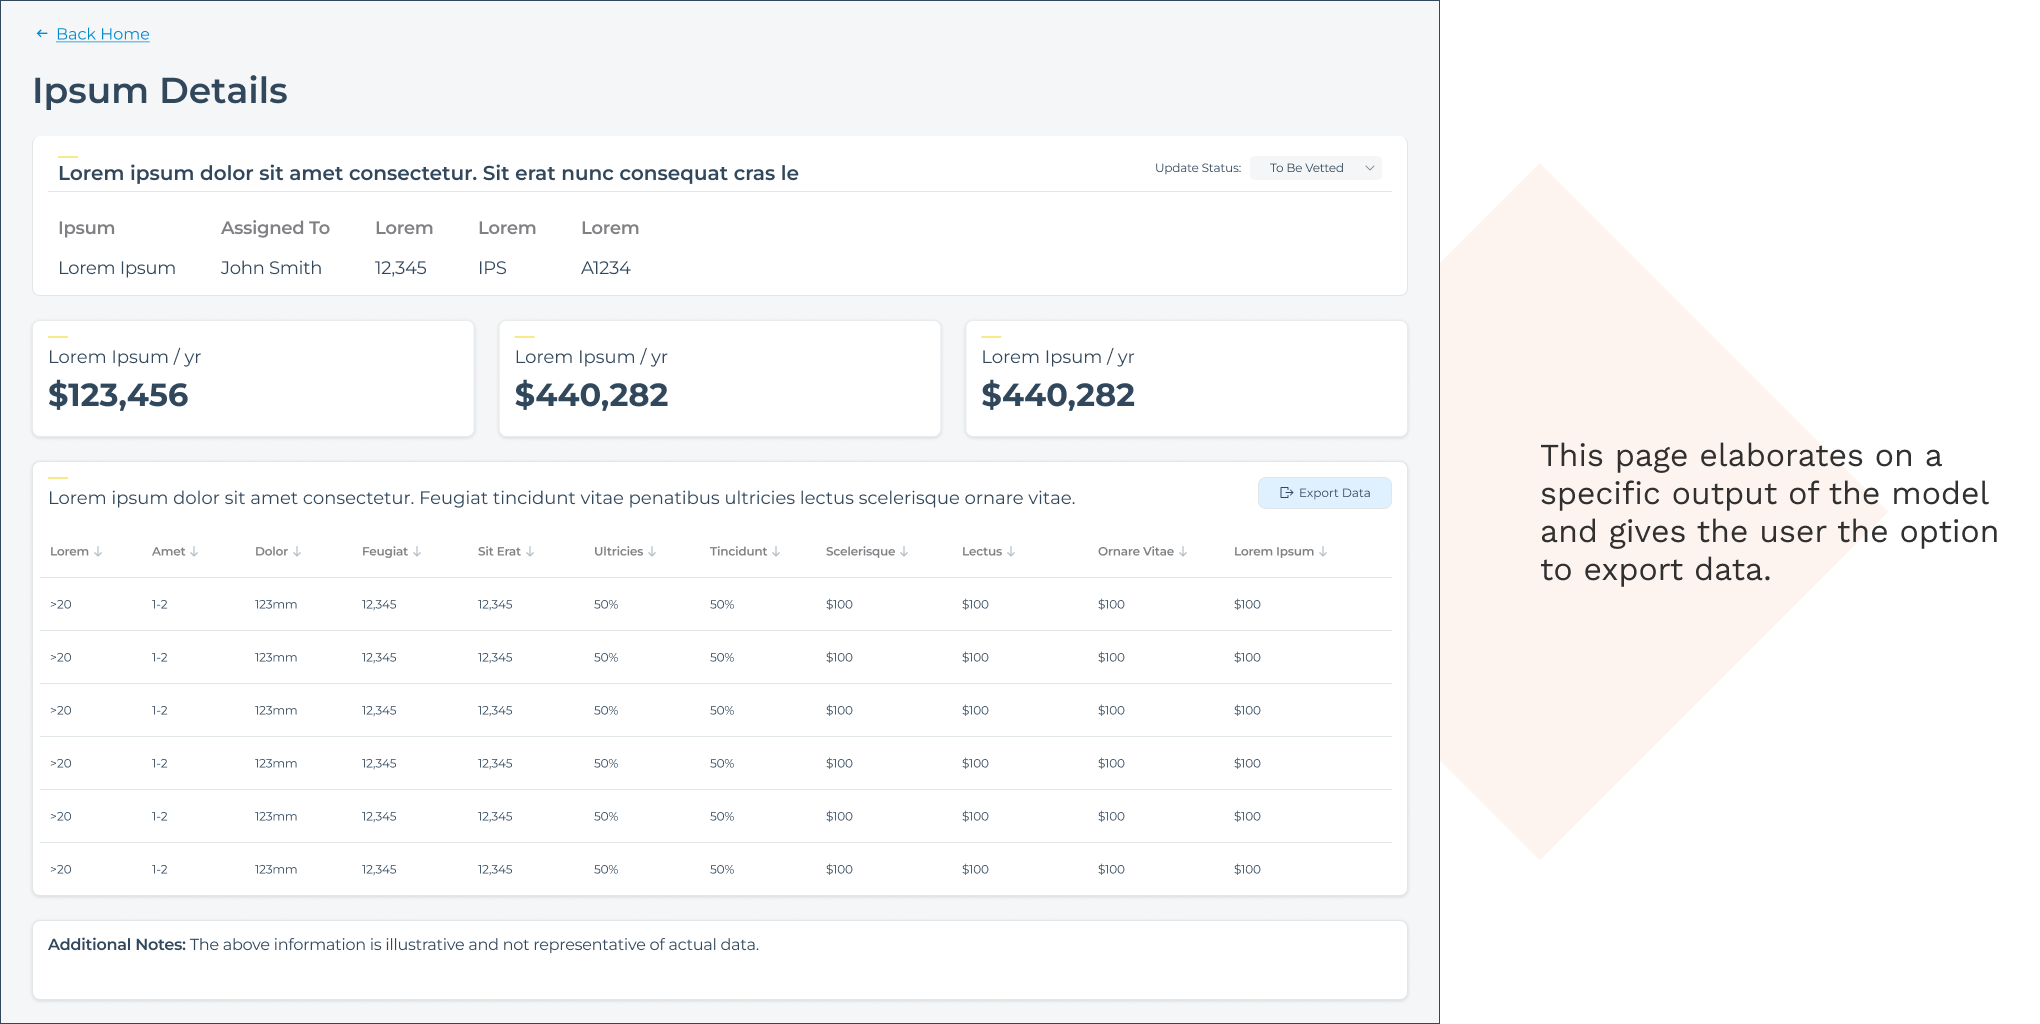
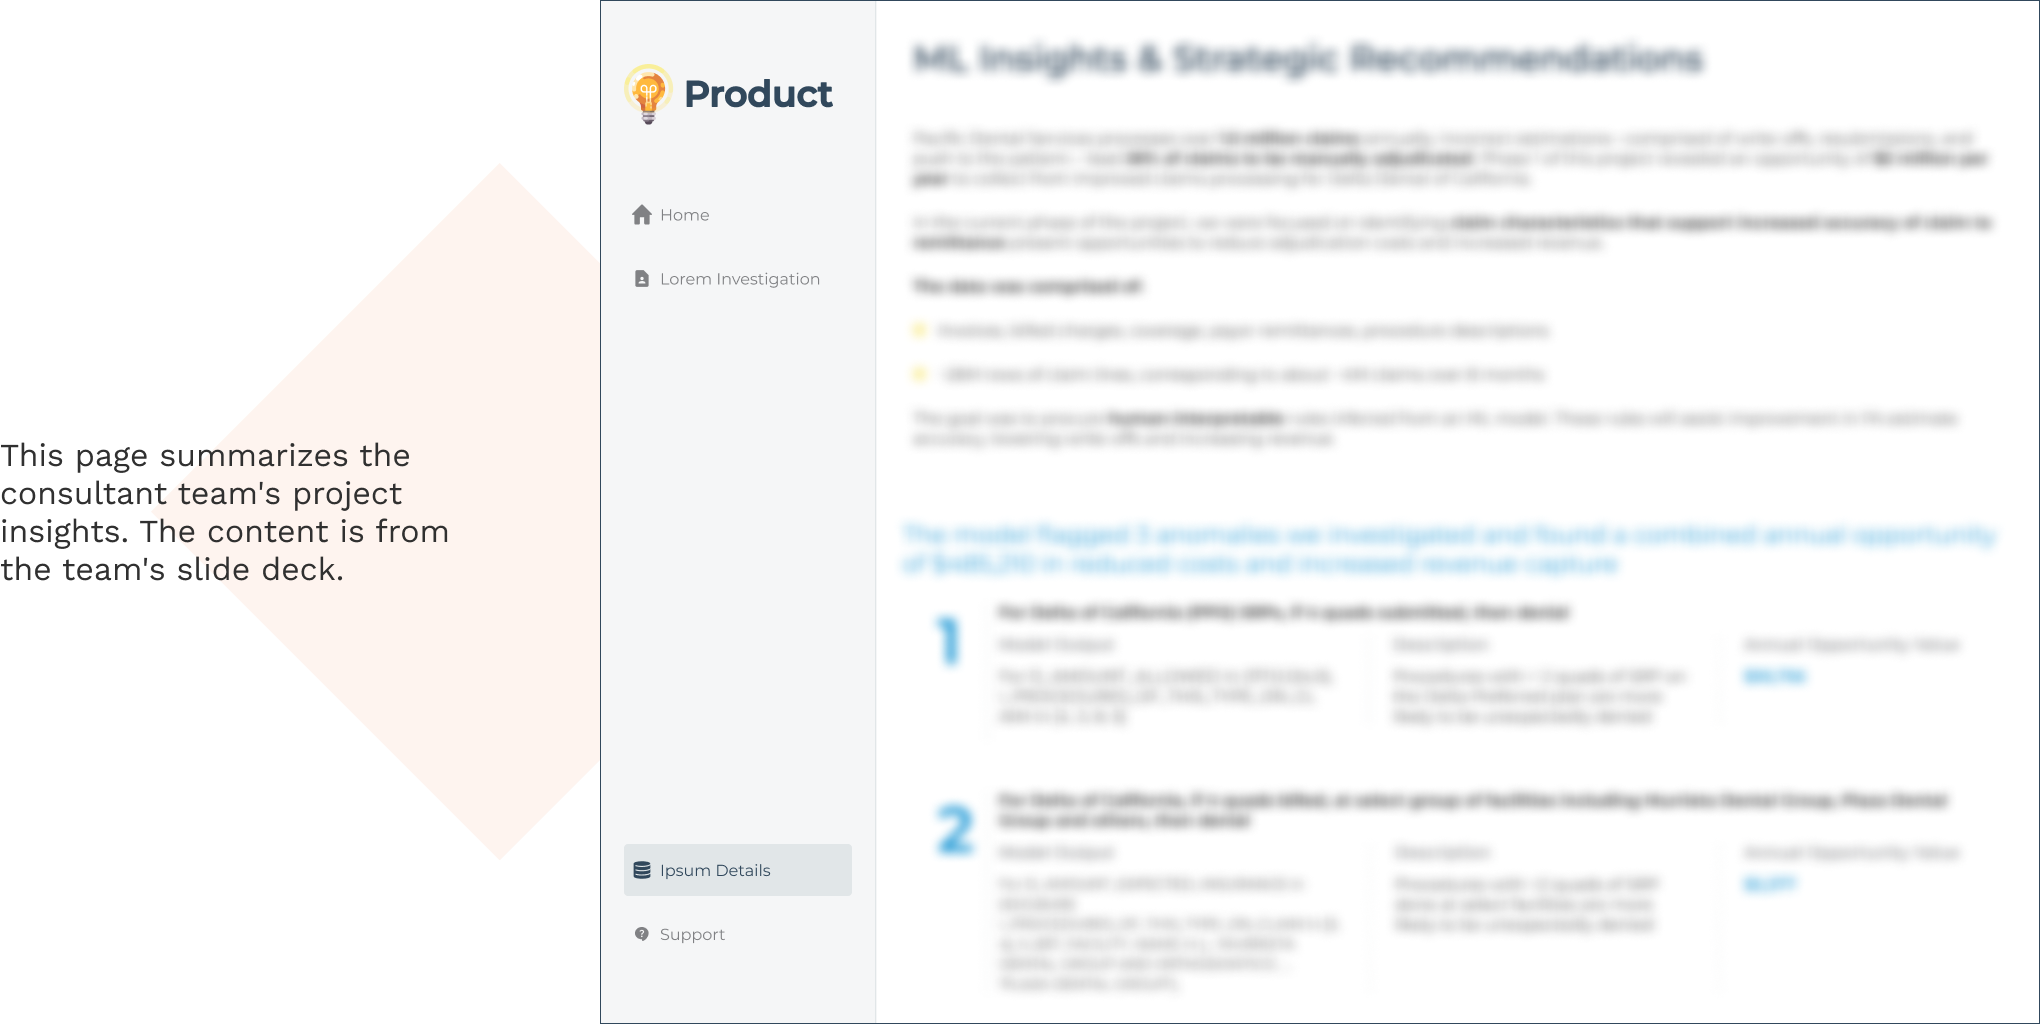
Nearing the last week, I became the only designer in charge, and for the next 4 days, I adjusted and modified the current design as additional data came in. In the end, I had addressed 26 critiques and recommendations from the team.
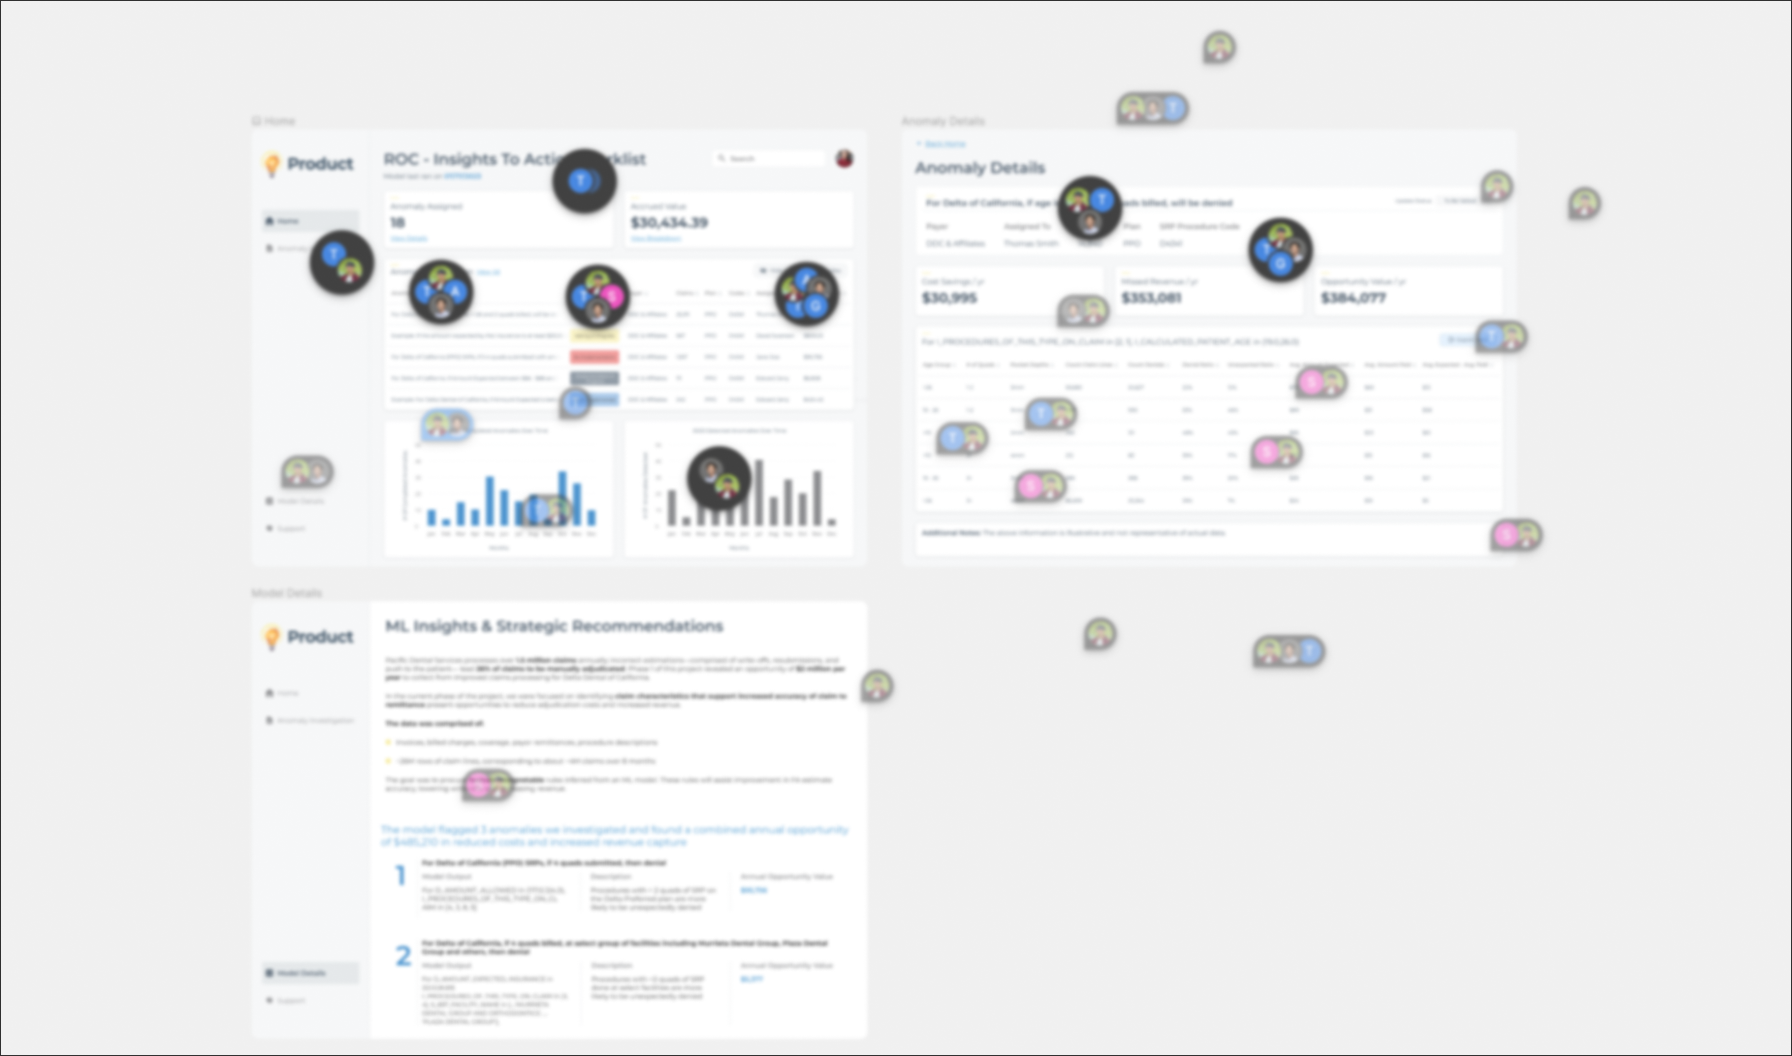
We delivered the designs with days to spare for the team to make any last-minute changes to the numbers before their presentation to the client’s Vice President, CFO, and CTO. Between the visuals and the team’s excellent insights, the firm scored a contract renewal. Our designs will live on in the form of a Powerbi dashboard.
This project taught me the importance of letting go of my work and adapting to unforeseen changes. In a setting where design is fluid, auto-layout has proven time and again to be instrumental in making design more manageable by allowing me to make changes to the content quickly.
I am glad I upskilled myself on Figma’s auto-layout over a weekend early in the project when I realized my experience with the feature was not up to standards and may slow down the project. If I had not done that, I would not have been able to take on my partner’s side of the work for a brief time.
Next Project
